Make Grid: The Visual Map That’s Solving Automation Chaos
Make, the automation platform trusted by thousands, just introduced Grid. It’s a new way to see, manage, and scale your automations visually.
Make, the automation platform trusted by thousands, just introduced Grid. It’s a new way to see, manage, and scale your automations visually.
Most teams track their automated workflows in static diagrams or someone’s memory. When things break, debugging becomes a nightmare.
Make Grid, launched June 25, 2025, changes that with a real-time, auto-generated map of your entire automation ecosystem.
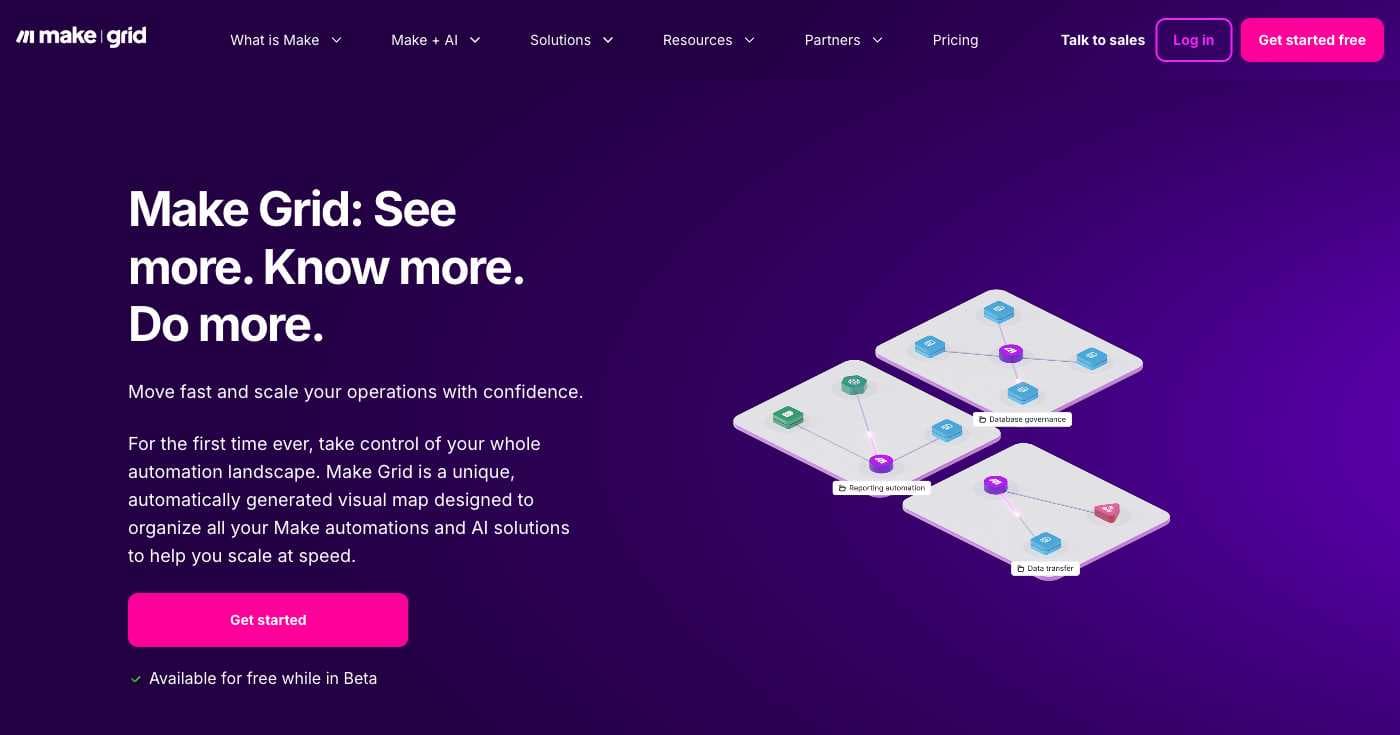
Why it matters: As businesses run hundreds of interconnected automations, a single API change can break dozens of workflows. Grid provides the missing visibility layer.
Feature | What it does | Why it matters |
|---|---|---|
Holistic, real-time map | Shows every scenario, module, table, webhook, and AI Agent in one canvas. | Eliminates shadow workflows and uncovers hidden dependencies. |
Search & dynamic filters | Narrow the view by app, owner, tag, or error state. | Instantly isolate the objects you care about (e.g., “all ClickUp lists touched by HR”). |
Dependency heat-map | Highlights “hot” objects with many inbound/outbound links. | Guides refactoring and risk analysis before you change anything critical |
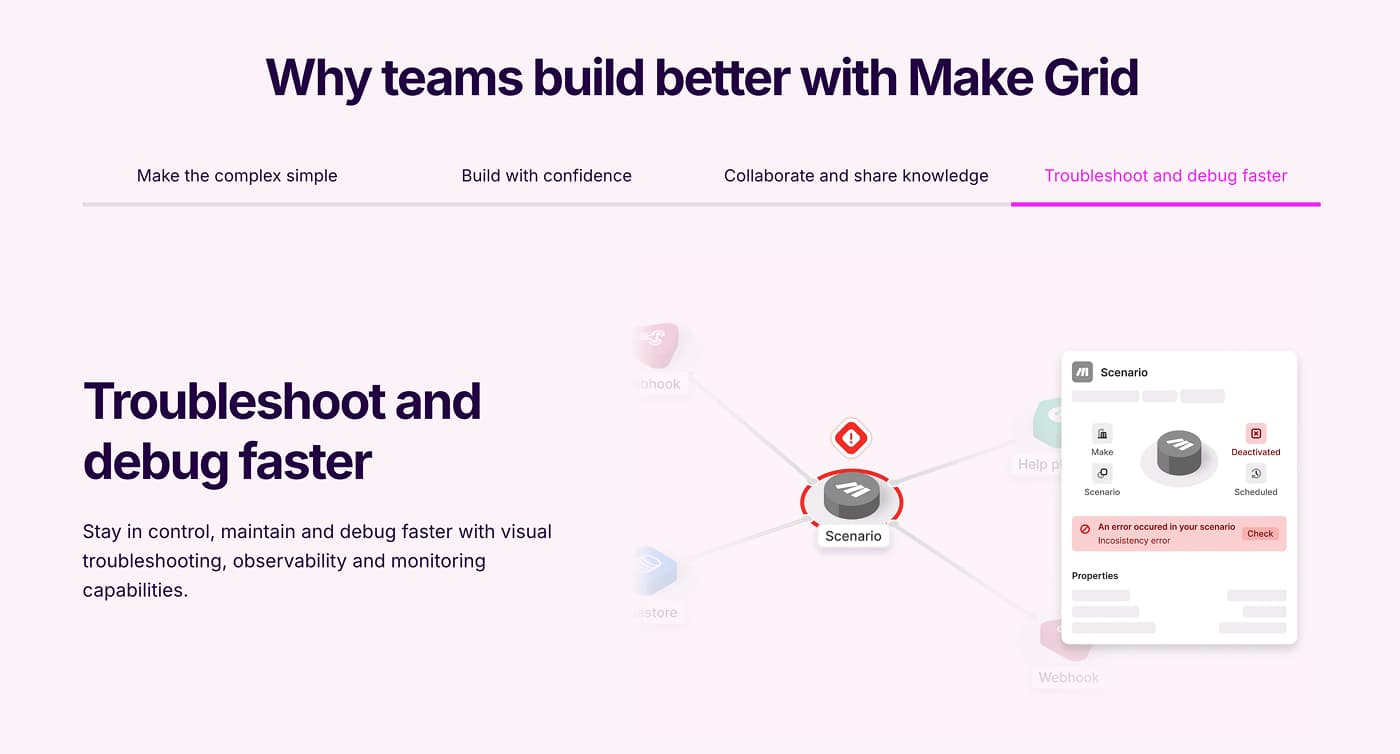
Data-flow inspection | Click any edge to see payload types, auth scopes, run counts, and latencies. | Speeds root-cause analysis without opening every scenario. |
AI transparency panel | Lists which AI Agents read or write a given record. | Helps meet governance, privacy, and audit requirements. |
One-click jump-in | Open the underlying scenario directly from Grid. | Cuts context-switching while you edit or debug. |
Beta pricing: free | Grid is included at no cost while in open beta. | Low-risk way to explore big-picture observability. |
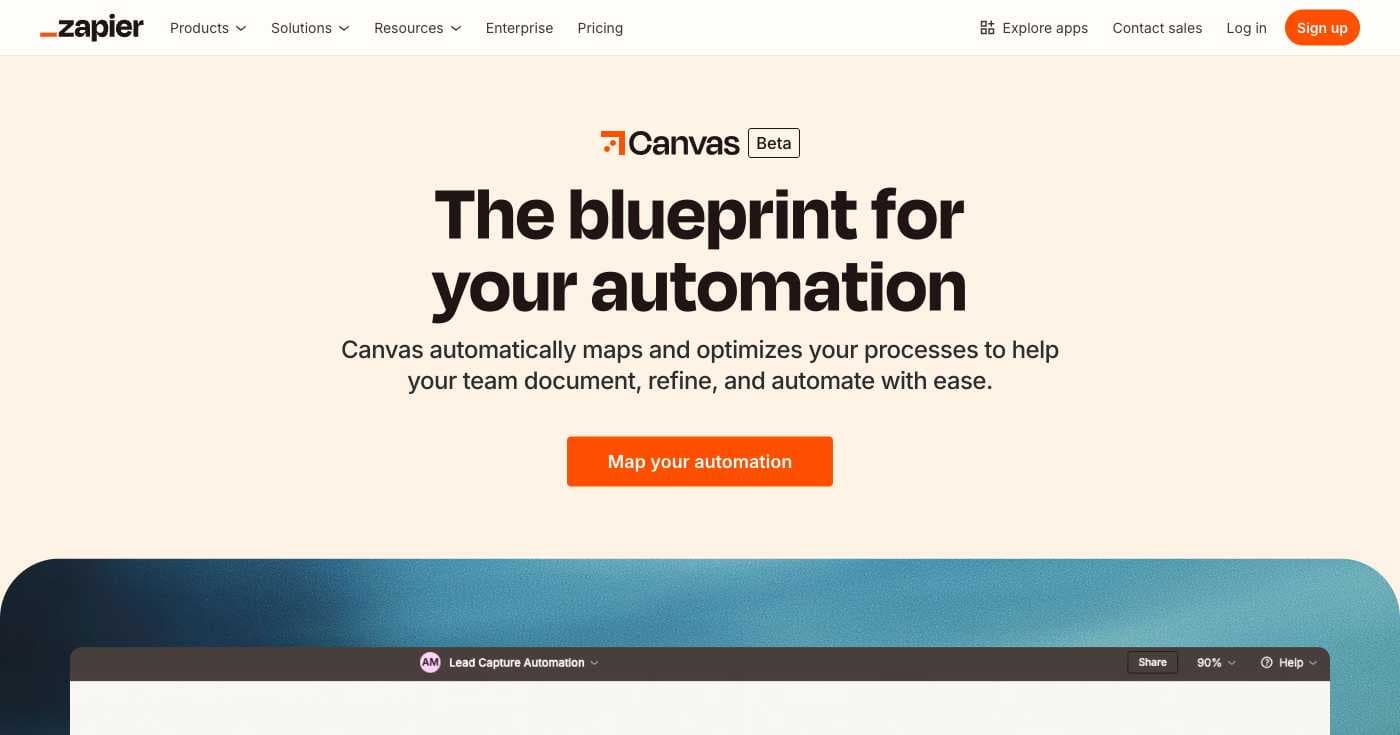
Make Grid | Zapier Canvas/Visual Editor | |
|---|---|---|
Generation | Auto-generated from live metadata | Manual or AI-assisted diagram you maintain |
Scope | Entire org’s scenarios, data stores & AI Agents | One Zap or process at a time |
Real-time updates | Yes | Requires re-export or refresh |
In-canvas edit & debug | Jump directly into any Make scenario | Limited; opens individual steps in editor |
Pricing | Free (beta) | Canvas in open beta, pricing TBD |
Sources: Make Grid launch notes, Zapier Canvas overview and Visual Editor guide.
While competitors race to add visualization features, Make Grid is already delivering six-figure ROI for early adopters. As AI explodes inside every workflow, this kind of visibility becomes essential—not optional.
Ready to see your automation chaos transformed into clarity? Try Make Grid’s open beta today.

Discover the top 20 marketing communities and groups to join in 2026 for networking, professional development, and expert advice.
Learn how to delete all your activity history on Google, including your search history, location history, and more. Complete guide updated for 2026.

Excel is one of the cornerstones of any marketer’s job. In this article, you will learn the 10 Microsoft Excel functions you need to master.